London Expands Service 29 Percent Reduces Budget 30 Percent January 30, 1997 London is converting its entire bus system to competitive contracting (competitive contracting).
London Transport (LT) has the developed world's largest public transit bus system with 6.000
buses and carrying 1.1 billion annual linked trips.(1) Under a parliamentary mandate, LT has
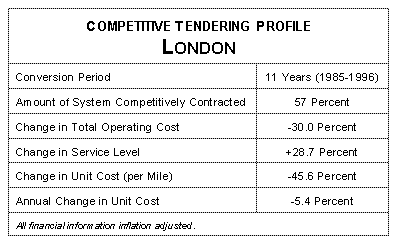
competitively tendered 57 percent of its bus services. During 1997, competitive tendering will be
expanded to approximately 80 percent; conversion to 100 percent will be completed in 1999.(2)
Nearly 40 companies provide service under more than 150 competitive contracts. Policy is
separated from operations.(3) LT usually competitively tenders by transit route but has
competitively tendered service areas as well. Companies may receive a single contract extension if
their services have met quality standards and if they are willing reduce their cost per mile by at
least 2.5 percent during the extension period. The quality of bus service has improved
substantially.(4) Policy is separated from operations.
Services have been
expanded 28.7 percent
over 11 years (1985-1996), while operating
expenses have been
reduced 30.0 percent
(inflation adjusted). Costs per vehicle mile
have dropped 45.6
percent, an annual cost
per mile reduction of
5.4 percent.
Ridership is up three
percent compared to a nearly 30 percent decline outside London, where transit has been
deregulated rather than competitively contracted.
The public operator won more than half of the competitive contracts until it was divided
into eleven firms and sold to private investors (including management and employee
buyouts). These former publicly owned companies continue to operate most of the
service, but at market rates.
Before competitive tendering, passenger fares covered 60 percent of operating and capital
costs. In 1996, passenger fares covered 94 percent of costs. In contrast, passenger fares
cover barely 50 percent of operating costs in the largest US transit systems.
In this competitive environment, London Transport has been able to improve Underground (subway or heavy rail) cost effectiveness to the point that fares now exceed operating costs (not including capital costs).

1. Linked trips count each passenger trip as one --- regardless of whether the passenger was required to transfer to a second or third bus to complete the trip. Unlinked trips count each "boarding" of a transit bus on the passenger trip. A single passenger trip can result in two or more unlinked trips. The United States Department of Transportation estimates unlinked transit trips to be 28 percent higher than linked transit trips. The Federal Transit Administration National Transit Database records unlinked trips, while transit agencies outside the United States tend to report linked passenger trips. As a result, US ridership figures tend to be overstated relative to ridership figures from other nations. 2. Correspondence from London Transport. 3. The following information is calculated from data in multiple annual editions of the London Transport Annual Report and Transport Statistics for London 1996, Department of Transport (London: 1996). 4. London Transport Annual Reports and Tom McLachlan, London Buses 1985-1995: Managing the Change, Venture Publications (London: 1996).
|

