US Urban Public Transport
Annual Ridership (5 Modes) &
Ridership per Capita: From 1970

Table

Chart

Year
Annual Passenger Journeys
Annual Passenger Journeys per Capita
Per Capita Compared to 1970
Annual Unlinked Trips (Including Transfers)
1970 6,101,000,000 29.91 0.0% 7,591,000,000
1971 5,711,000,000 27.61 -7.7% 7,106,000,000
1972 5,487,000,000 26.22 -12.3% 6,827,000,000
1973 5,544,000,000 26.23 -12.3% 6,899,000,000
1974 5,777,000,000 27.08 -9.5% 7,189,000,000
1975 5,812,000,000 26.97 -9.8% 7,232,000,000
1976 5,900,000,000 27.12 -9.3% 7,341,000,000
1977 6,068,000,000 27.61 -7.7% 7,551,000,000
1978 6,335,000,000 28.52 -4.6% 7,883,000,000
1979 6,766,000,000 30.13 0.7% 8,419,000,000
1980 6,857,000,000 30.18 0.9% 8,532,000,000
1981 6,616,000,000 28.83 -3.6% 8,232,000,000
1982 6,429,000,000 27.75 -7.2% 8,000,000,000
1983 6,548,000,000 28.01 -6.4% 8,148,100,000
1984 6,946,000,000 29.45 -1.5% 8,642,700,000
1985 6,466,000,000 27.18 -9.1% 8,276,300,000
1986 6,145,000,000 25.59 -14.4% 7,865,800,000
1987 6,078,000,000 25.09 -16.1% 7,779,400,000
1988 6,016,000,000 24.61 -17.7% 7,700,700,000
1989 6,250,000,000 25.32 -15.3% 8,000,600,000
1990 6,043,000,000 24.23 -19.0% 7,735,400,000
1991 5,860,000,000 23.24 -22.3% 7,501,000,000
1992 5,923,000,000 23.23 -22.3% 7,581,600,000
1993 5,714,000,000 22.17 -25.9% 7,313,500,000
1994 5,787,000,000 22.24 -25.7% 7,407,000,000
1995 5,848,000,000 22.26 -25.6% 7,305,500,000
1996 5,901,000,000 22.25 -25.6% 7,371,200,000
1997 6,029,000,000 22.53 -24.7% 7,745,300,000
1998 6,155,000,000 22.77 -23.9% 7,906,900,000
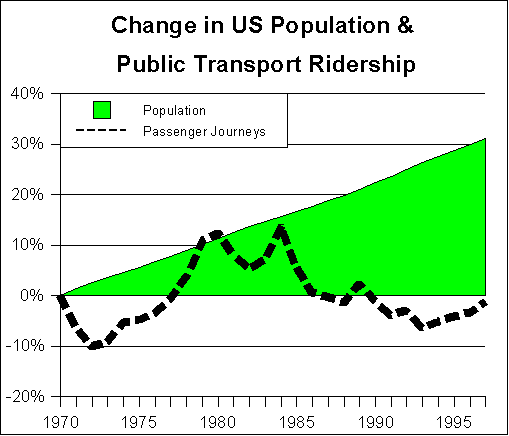
Source: Calculated from National Transit Database and American Public Transit Association data.

Passenger Journeys estimated using Nationwide Personal Transportation Survey transfer factors

More than 55 percent of the unlinked trip increase from 1996 to 1997 was attributable to free transfers allowed between subways and buses in New York. Free transfers were not previously allowed. This increase is not, as a result, reflective of the trend in actual passengers carried during the period (based upon analysis of passenger journey data provided by the New York City Transit Authority to Jane's Urban Transport). Passenger journeys data is adjusted to account for this change.

5 Modes: Regional Rail, Metro/Heavy Rail, Light Rail/Tram, Motor Bus, Trolley Bus.

(c) 2000 www.publicpurpose.com --- Wendell Cox Consultancy --- Permission granted to use with attribution.
 NAVIGATION & PUBLICATION SERIES
NEW ITEMS
The Public Purpose
Demographic Briefs
Government Cost Review
Gov't Employment Fact Book
Highway & Motorway Fact Book
HOME
Intercity Transport Fact Book
Labor Market Reporter
Realities
School Transport Fact Book
Transport Fact Book
BOOK STORE
Urban Policy
Urban Transport Fact Book
Competitive Tendering Website
Intl Comp. & Ownership Conference

 WEBSITE INFORMATION
Contact by E-Mail
Subscribe (Free)
Corrections Policy & Rights

The Public Purpose
WENDELL COX CONSULTANCY
P. O. Box 841 - Belleville, IL 62269 USA
Telephone: +1.618.632.8507 - Facsimile: +1.618.632.8538
Demographia
DEMOGRAPHIA
Demographics, Development Impacts,
Market Research & Urban Policy