Number 57 - May 2003
How Higher Density Makes Traffic Worse
By Wendell Cox
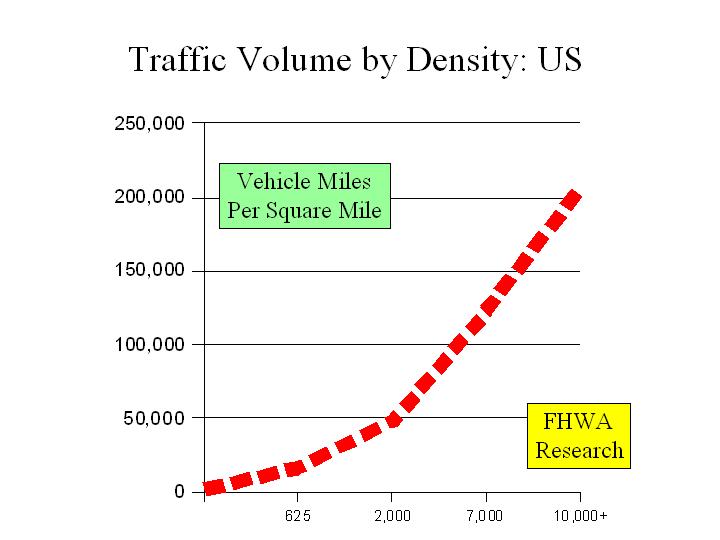
One of the principal reasons that "smart growth" or "compact city" urban strategies cannot reach their objective of reducing traffic congestion (or reducing its growth) is that there is a strong positive relationship between higher population density and higher traffic volumes. The most fundamental requirement of smart growth or compact city strategies is higher population densities. The fundamental problem is that as population densities rise, vehicle use also rises. Perhaps the most significant research was performed for the Federal Highway Administration, which found, generally, that traffic volumes at typical densities tend to rise at least 80 percent of the rate of population density increase (Figure 1 & Note 1). This means that if an area experiences and increase of 100 percent in population per square mile, vehicle miles per square mile can be expected to increase 80 percent.
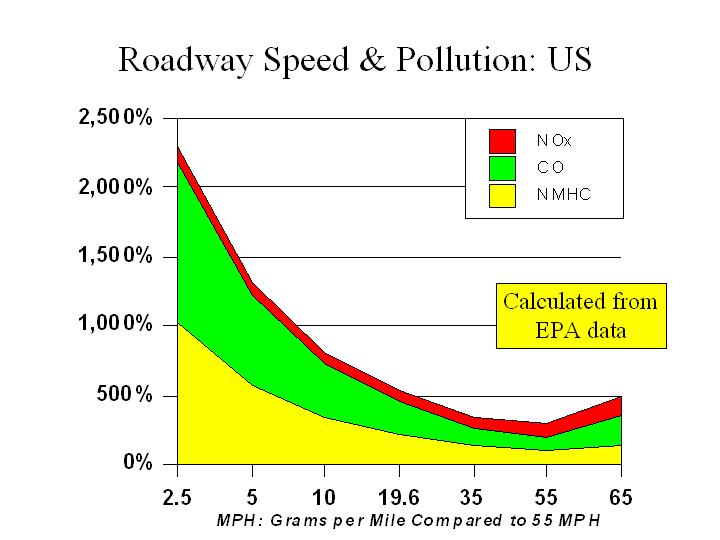
But there is more to it than that. As more vehicle miles occur in a confined geographical location (again, a requirement of smart growth or compact city strategies), traffic slows down and is subject to more "stop and go" operation. This further increases not only the time spent in traffic (vehicle hours per square mile), but also air pollution emissions per square mile (Figure 2, calculated from US EPA data). This more intense exposure to air pollution can have negative health impacts (even as overall air pollution levels are falling).
Further evidence is provided by the Texas Transportation Institute 2000 database (from Federal Highway Administration data) for the nation's urban areas with more than 1,000,000 population. A linear regression analysis shows a strong relationship between higher population density and higher traffic volumes (Table). The formula predicts that an urban area with a population density of 5,000 (such as Los Angeles) will have traffic volumes per square mile nearly three times that of an urban area with a population density of 1,000 (such as Nashville) (Note 2).
A rank order analysis of the same data shows similar results. Urban areas with densities of more than 4,000 per square mile tend to have traffic volumes per square mile nearly double that of urban areas with densities below 2,000 (Table).
The international data reveals virtually the same dynamic. The higher densities of urban areas outside the United States are associated with much higher traffic volumes per square mile (despite their usually far superior transit systems). The highest density urban areas have traffic volume levels 2.5 times that of the lowest (Table). But there is more. Because of the slower speeds associated with higher traffic volumes, the time spent in traffic is even greater. Vehicle hours per square mile are five times as high among the highest density urban areas compared to the lowest. US traffic volumes per square mile are lower than the lowest international category, while vehicle hours per square mile are similar.
It should also be noted that there is a difference between measures of traffic congestion (such as the Travel Time Index or delay per person) and measures of traffic volume (such as actual vehicle miles). An urban area with a balanced (freeway and arterial) and well designed roadway system is likely to have less traffic congestion than an another urban area with the same traffic volume and a poor roadway system. This is the principal reason, for example, that Atlanta has much worse traffic congestion than Milwaukee, which has a similar traffic volume. Atlanta is largely without an effective arterial street system that supports and provides alternates to its freeways.
Note 1: Calculated from US Census Bureau data and Catherine E. Ross and Anne E. Dunning, "Land Use and Transportation Interaction: An Examination of the 1995 NPTS Data," Searching for Solutions: Nationwide Personal Transportation Survey Symposium, US Federal Highway Administration, October 29-31, 1997). Note 2: In actuality, Los Angeles traffic volumes per square mile are 3.1 times that of Nashville.
The Public Purpose: One of National Journal's Top 4 Transport Internet Sites
| |||||||||||||||||||||||||||||||||||||||||||||||||||||||||||||||||||||||||||||||||||||||||||||||||||||||||||||||||||||||||||||||||