
Redirecting CTA to Serve Customers First Wendell Cox & Jean Love Wendell Cox Consultancy Metropolitan Transit Association Chicago March 1998
EXECUTIVE SUMMARY
Public Transit in Chicago
Public transit is an important public service. Transit provides mobility for people without access
to automobiles, especially people with low income. Transit also provides an alternative for
people with automobiles, thereby reducing traffic congestion and air pollution.
Transit is particularly important in the city of Chicago, where Chicago Transit Authority (CTA)
ridership is six times the national rate per capita. But CTA ridership has fallen precipitously --- in
fact CTA's ridership loss represents nearly one-quarter of the national transit ridership loss over
the same period. Since 1979, ridership has dropped 39 percent, with a daily reduction of 450,000
two way customers. The ridership decline has steepened during the 1990s.
The ridership loss has been much greater than either the population or employment decline in the
city of Chicago. The most important factor appears to be escalating fares. Since 1979, CTA fares
have nearly tripled. The ridership losses have been approximately what experts would predict to
occur from fare increases of this magnitude. The bus system has sustained the greatest ridership
losses.
For years, CTA has operated in what amounts to a perpetual budget crisis. Costs have risen faster
than revenues, and budgets have been balanced by fare increases. The future looks no more
promising, as large deficits are projected. Ridership losses can be expected to continue if fares
are not stabilized. If present trends continue, it is projected that bus ridership will drop another 38
percent over the next 10 years.
CTA faces three alternatives with respect to its challenging future. First; CTA can continue to
rely upon fare increases, which could reduce bus ridership by nearly 40 percent over the next
decade. Second; CTA can balance its budget by reducing service levels, which will also drive
riders way. Or, third; CTA can implement substantial productivity improvements, which would
enable stabilization of fares, service levels and ridership.
Competitive Contracting
Transit agencies throughout the developed world are dealing with similar challenges. As costs
have continued to grow faster than revenues, the most frequent and effective productivity
improvement strategy has been competitive contracting.
Under competitive contracting, the transit authority offers transit services to competitive
procurement by both public and private entities. The transit authority retains full policy control,
determining timetables, routes, fares and service standards. Services are organize into an
integrated marketing whole, under the control of the transit agency. Use of the competitive
market reduces costs and future cost escalation, making it possible to maintain or increase service
levels, retain low fares and stop the reduction in ridership.
Entire bus and rail transit systems are being converted to competitive contracting in Europe,
Australia, New Zealand and Africa. For example, the developed world's largest bus system,
London Transport, is now nearly 60 percent competitively contracted and will be fully converted
in 1999.
Improving CTA Through Competitive Contracting
It is estimated that CTA bus costs per vehicle hour are approximately 43 percent higher than the
competitive cost of producing bus service in Chicago.
CTA could implement a program of competitive contracting while guaranteeing the jobs and
income of present employees. This "Job Guarantee" alternative would involve conversion of
services to competitive contracting at the rate of employee attrition. A first year program
comprised of 15 routes on both the north and south sides is proposed.
By 2007, approximately 45 percent of CTA bus services would be competitively contracted. The
lower costs would permit the base fare to be reduced to approximately $1.25 (not inflation
adjusted), and ridership could increase by eight percent. This is in comparison to a 38 percent
ridership loss projected if current trends continue.
The proposed "Job Guarantee" alternative would provide substantial benefits to CTA customers
and the community. Fare increases would be avoided, and ridership would be stabilized. If
savings were used to expand services, while maintaining fare increases within inflation, up to
1,350 new jobs could be created. Further, competitive contracting would provide new
opportunities to minority and disadvantaged businesses.
Securing a Better Transit Future for Chicago
CTA cannot achieve its public purpose unless it commits its resources, without reservation, to serving its customers.  Competitive contracting offers CTA the opportunity to provide greater mobility to its customers.
CTA should begin the process of recovery by competitively contracting as much service
immediately as can be accommodated without laying off employees. To remain viable in the
longer term, Chicago will require an intensively used, quality public transit system. Both CTA's
riders and the city deserve no less than the improved transit that competitive contracting would
bring.
1. PUBLIC TRANSIT IN CHICAGO
Public Transit is Important to Chicago
Public transit serves important public purposes in the Chicago area and especially in the city of
Chicago.
Public transit provides basic mobility for people without access to automobiles (the
"transit dependent"), while providing alternative travel opportunities to people who
would otherwise travel by automobile ("discretionary" riders).
As a substitute for automobile use, public transit reduces traffic congestion and air
pollution, while supporting higher density residential and commercial development.
CTA Ridership is Declining Rapidly
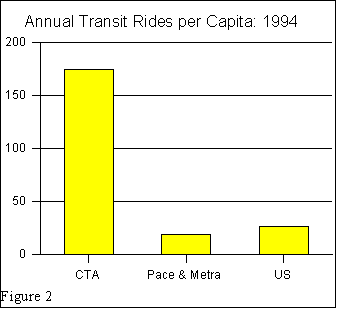
Despite transit's importance to Chicago, severe ridership losses have been sustained in recent
years. Since the ridership peak of 721 million in 1979, CTA bus and rail ridership has dropped to
442 million (1995), a reduction of 39 percent.(3) This translates to an estimated weekday reduction
of approximately 450,000 customers (round trip riders).(4) Per capita annual ridership declined
from 237 to 162 --- a reduction of 32 percent. During the 1980s, ridership dropped 25 percent ---
a rate of minus 1.6 percent annually. During the 1990s, the ridership decline has more than
tripled to minus 5.5 percent annually (ridership dropped 25 percent from 1990 to 1995) (Figure
#3: CTA Ridership: 1979-1995).
CTA's ridership loss was greater than total transit ridership in Seattle, Houston, St. Louis and
Cincinnati combined. CTA alone, which carries approximately six percent of the national transit
ridership, accounted for 24 percent of the national transit ridership decline from 1979 to 1994
(Figure #4: Ridership Loss: CTA & US: 1979-1994).(5)
The bulk of the ridership drop --- 94 percent --- occurred on CTA buses. From 1979 to 1995 ridership declined 46 percent, an estimated 429,000 daily persons served (weekday round trips are estimated to have declined from 926,000 to 497,000). CTA's lost bus customers exceed the population of St. Louis. As with combined bus and rail ridership, the bus ridership decline has accelerated in the 1990s to minus 6.2 percent annually, compared to minus 2.4 percent annually in the 1980s (Figure 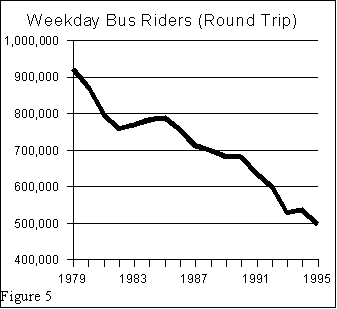 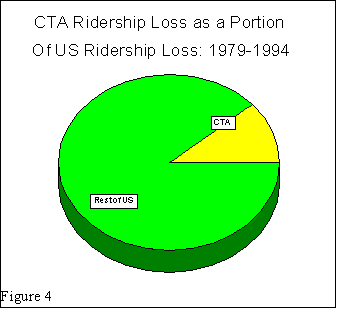 A number of factors have contributed to CTA's ridership loss.
Part of the reason is the population decline in the service area. From 1979 to 1995, the
population of the city of Chicago declined by 11 percent.(6) This, however, was a
significantly smaller reduction than the overall CTA ridership loss of 39 percent and the
CTA bus ridership loss of 46 percent over the same 1979(7) to 1995 period (Figure #6:
Trends: Chicago Population & CTA Ridership).
Employment has declined in Chicago, but the decline has been of a far smaller magnitude
than the ridership decline at CTA. From 1980 to 1990, the city lost 2.3 percent of its jobs,
while CTA lost more than 15 percent of its ridership(8) --- more than six times the job loss
percentage.(9)
There is an "underlying" downward trend in national transit ridership. Ridership has
declined 14 percent since 1979 (minus 0.9 percent annually). However, CTA's ridership
loss has been 2.8 times as great, at 39 percent.
Service levels have been relatively stable and are therefore not a contributing factor to CTA's ridership loss.
Fares have risen substantially. The average fare per passenger nearly tripled from 1979 to
1995.(10)
Fare Increases Drive Ridership Losses
It is well known that fare increases tend to drive away riders. The American Public Transit
Association (APTA) has estimated that each 10 percent increase in fares reduces transit ridership
by 3.6 percent in large cities.(11) CTA ridership has been very sensitive to fare increases. Between
1979 and 1981, the average fare increased by 56 percent (not inflation adjusted). From 1979 to
1981, annual ridership dropped from 721 million to 641 million --- 12 percent --- somewhat less
than the 20 percent reduction that the APTA formula would project..
The average fare per passenger remained stable from 1981 to 1985, and ridership also remained
stable, at 642 million. Since 1985, fares have been increased 87 percent, and ridership has
dropped 31 percent --- almost precisely the reduction predicted by the APTA formula.(12) This
leads to the conclusion that fare increases are the single most important cause of CTA's ridership
decline (Figure #7: Impact of Fare Increases on Ridership: Actual v. APTA Formula Predicted).
But while riders were being driven away by higher fares, CTA failed to reap a financial bonanza. In inflation adjusted terms, total CTA fare revenue in 1995 was the lowest in the last 15 years --- and 10 percent lower than in 1979 (inflation adjusted). And in nominal dollars (non-inflation adjusted), total fare revenue was only 10 percent higher in 1995 than in 1988, despite an average fare per passenger increase of 50 percent. Over the same period, bus ridership dropped by nearly 30 percent --- an indication that the point of diminishing returns from fare increases has long since been reached in terms of customers (Figure #8: Trends: Average Fare, Fare Revenues & Ridership). 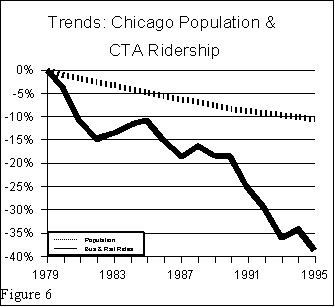 CTA ridership has been driven away by substantial fare increases. This could have been
predicted with considerable accuracy based upon national research that was available at the time
the fare increases were approved.
The Perpetual CTA Budget Crisis
CTA has faced virtually annual budget crises. Operating costs have continued to rise at a rate
above that of projected fare and subsidy revenues. CTA has generally closed threatened budget
deficits by raising fares. So long as CTA costs continue to rise faster than revenues, fare
increases will be required, and more customers will be driven away. Indeed, substantial future
deficits are now projected --- $200 million in 1997 to 1999 alone.(13)
The Human Costs of CTA's Decline
The overwhelming percentage of the lost passengers have been bus riders. The higher CTA fares
restrict the mobility of low income people, making it more difficult for them to obtain and
maintain jobs. The city's low income population needs more access to CTA service, not less.
CTA buses could be very important in the near future, as welfare reform requires up to 100,000
Chicago welfare recipients to obtain jobs.(14)
The Environmental Costs of CTA's Decline
Chicago's high levels of transit ridership have historically played an important role in limiting the growth of traffic congestion, while helping to control the growth of air pollution. As riders abandon CTA services, more trips are taken by automobile, adding to an already significant traffic congestion problem, and increasing air pollution. Metropolitan Chicago is already one of the nation's five most congested metropolitan areas. Moreover, on a population adjusted basis, Chicago's traffic congestion is growing faster than all of the more congested areas.(15) 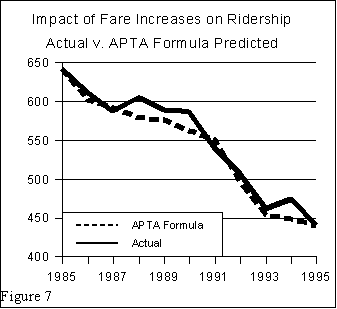 CTA is important to customers and to the community. But riders are abandoning CTA services in
large numbers. For CTA to maintain or expand its contribution to the community and its
customers, fares must be stabilized and service levels maintained. CTA's resources and planning
must be focused exclusively on the needs of customers.
Chicago, CTA and the Future
There is no reason to believe that CTA's revenue situation will improve significantly in the near
future. Public funding for transit is not likely to grow in real terms. Cost increase pressures are
continuing. CTA forecasts expenditure increases of nearly $100 million from 1996 to 1999,
while anticipated revenues and subsidies are anticipated to increase only $20 million.(16)
Comparing current cost trends with current revenue trends, the costs of present service levels
could exceed available revenues by up to $500 million over the next decade. If CTA's operating
strategies remain unchanged, this will necessitate further fare increases and service reductions.
If fare increases are used as the primary mechanism to balance budgets, CTA bus ridership is
likely to fall another 38 percent over the next decade (1997 to 2007) to 188 million annual rides
(Appendix: Model Assumptions).(17) Weekday persons served (round trip rides) would decline by
191,000 to 306,000 (Figure #9: Bus Ridership Projection: Present Trend (Status Quo)).
Alternatively, if CTA balanced its budgets over the next decade by reducing service levels, service levels could be reduced 25 percent. Up to 1,350 full time operating jobs (bus drivers, mechanics and support personnel) could be eliminated. 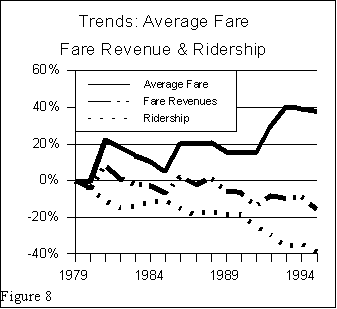 CTA faces three choices with respect to balancing its budget in the future:
continuing fare increases,
substantial service reductions or
productivity improvements that permit stability in fares and services.
The first two --- fare increases and service reductions --- are only temporary measures, and must
be repeatedly called upon as deficit crises continue to arise in the years to come. Only the third
alternative --- productivity improvements --- can make present service levels sustainable and
permit sustainable fare reductions, thus solving future budget crises and placing the interests of
CTA customers first.
2. COMPETITIVE CONTRACTING
Other transit agencies have coped much better with stable or declining funding by significantly
improving their productivity through lower unit operating costs (costs per hour or mile). This has
made it possible to not only maintain ridership and avoid significant fare increases, but also to
increase transit ridership. By far the most reliable and successful strategy has been competitive
contracting.
Public transit costs have risen to well-above competitive market rates in virtually all developed nations in which services are produced directly by government agencies. In response, transit authorities have increased fares and decreased service levels. And ridership has fallen significantly. To arrest these trends, governments around the world have begun to convert public transit systems to competitive contracting, which reduces unit costs while permitting full public control of fares, routes and service specifications. The primary reason behind this trend has been to improve productivity through market determined costs. Competitive contracting has been implemented by conservative, liberal and socialist governments. 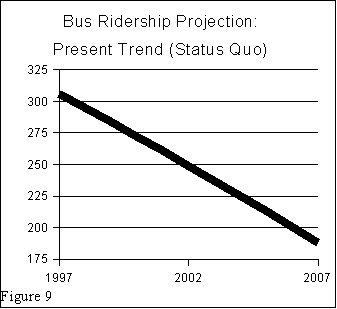 What Is Competitive Contracting?
The public authority purchases transit services (individual routes or groups of routes) from the
competitive market, awarding service contracts to the lowest responsible and responsive
proposer. It is also called "public-private competition" since public agencies may also compete
for services.
The public authority retains full control over policy, routes, schedules, fares, vehicle livery, and
service standards. To the customer, the transit system remains an integrated whole with no
apparent changes. The best results are obtained where the public authority exercises strong policy
control and where a competitive market is encouraged through short term contracts (usually three
to five years), prohibition of post-contract execution price negotiation,(18) and smaller contracts
(this encourages participation by smaller local operators and disadvantaged business
enterprises). Larger transit systems may administer a number of service contracts. Vehicles and
capital facilities may be publicly or competitively provided. Where private contractors provide
capital assets, transit agency financial reserves can be reduced.
What Competitive Contracting Is Not
Competitive contracting is not deregulation --- services remain under the full policy control of
public authorities. Nor is competitive contracting a reversion to the former private monopoly
approach that preceded the public takeover of transit. Unlike these approaches, competitive
contracting relies on publicly managed competition.
Results
Competitive contracting has reduced unit costs in three ways --- directly: through lower service
costs; indirectly: through "ripple effect" impacts on services that have not been competitively
contracted; and through higher taxes generated from contractors. Generally, the competitive
contracting costs have remained stable or been reduced in relation to inflation. Savings, typically
20 percent to 40 percent, have been used to expand transit services and to balance budgets.
Lower costs result from administrative efficiencies, improved management of the work force,
more productive work rules, better utilization of equipment and facilities, improved maintenance
practices, and labor compensation consistent with competitive market rates (contractor work
forces may be union or non-union). In the United States, competitive contracting has resulted in
no public employee layoffs and no reductions in compensation for any employee. Public transit
agency employee compensation before competitive contracting was closer to competitive market
rates in Europe, Australia, and New Zealand than it is in the United States.
The savings from competitive contracting can be used to balance budgets, increase service levels
or reduce passenger fares.
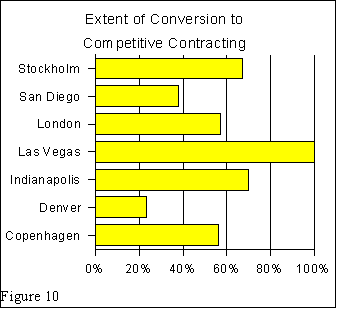
Extent
Approximately 10 percent of fixed route and more than 70 percent of paratransit service is
competitively contracted in the United States.(19) The European Union is encouraging conversion
of public transit systems to competitive contracting under the direction of Transport Minister
Neil Kinnock (former British Labour Party leader).(20)
... the concession system (competitive contracting) - where services are subject to open
tender but within a defined operational framework - is well suited to providing an
environment which gives incentives to operators to raise standards whilst safeguarding
system integration which is particularly important to urban and regional transport. The
Commission ... will look at ways of promoting the concession (competitive contracting)
system.
  Cases
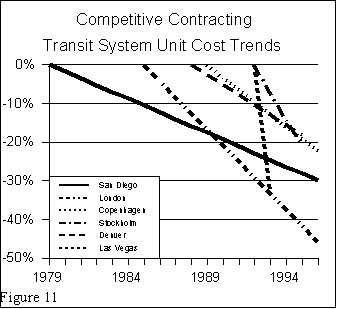
The following cases are reflective of the experience (all financial comparisons inflation adjusted)
(Figure #11: Competitive Contracting: Transit System Unit Cost Trends).
San Diego has converted 37 percent of its bus system to competitive contracting since 1979. San
Diego is continuing its conversion at a rate that guarantees the jobs of present public transit
agency employees (there have been no layoffs). More than 100 buses are now competitively
contracted.
Services that are competitively contracted (1995) cost 50 percent less than San Diego bus
system costs in 1979.
Services that are competitively contracted cost 34 percent below the present costs of
services not competitively contracted.
As a result of competitive contracting, system wide bus costs per vehicle hour have
dropped 30 percent (inflation adjusted). From 1979 to 1996, bus costs were $475 million
less than if costs had risen at industry rates. This is nearly $100 million more than San
Diego spent to build its first two light rail lines (inflation adjusted).
System-wide bus costs have risen three percent, which has made it possible to increase
service levels by 47 percent since 1979.
"Ripple effect" savings have reduced the costs of non-competitive (former public
monopoly) service by 25 percent per vehicle hour (inflation adjusted).
The former public monopoly has won competitive contracts.(22)
Las Vegas: Fast growing Las Vegas has converted its entire public transit system from private
monopoly operation to competitive contracting --- the first such complete conversion in a major
US urban area. Las Vegas operates 190 buses and carried 32 million unlinked trips in 1996.
Ridership has more than tripled since competitive contracting began, placing Las Vegas among
the top 25 US urban areas in public transit ridership. The Las Vegas work force is represented by
the Amalgamated Transit Union.
The 100 percent conversion of the Las Vegas public transit system was immediate. In the
first year of operation, total operating expenditures rose 135 percent, while service levels
were increased by 243 percent.
Costs per vehicle hour dropped 33.3 percent (inflation adjusted).
Las Vegas has the lowest unit cost of the 50 US largest public transit systems: 40 percent below average.(23) 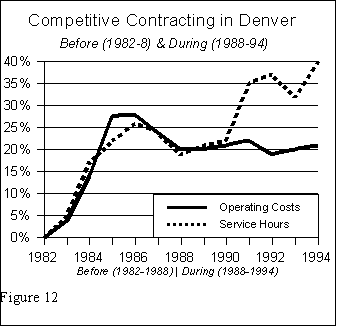 Denver: A 1988 Colorado state law required a partial conversion (20 percent) of Denver's
Regional Transportation District (RTD) bus service. The success of the program has induced
RTD to expand competitive contracting to 25 percent of its system. More than 180 buses are now
competitively contracted.
Annual cost savings were 33 percent through 1994 and are increasing. RTD's most recent
procurement yielded a savings of 41 percent and will produce $25 million in savings over
five years (approximately 60 buses).
Since beginning competitive contracting, RTD has increased bus service levels by 25.6
percent, while operating costs have increased only 3.0 percent (1988 to 1995, inflation
adjusted). In contrast, during the six years before competitive contracting, operating costs
rose 18.8 percent, while service levels were increased by 17.5 percent.
"Ripple effect" savings have reduced the costs of non-competitive (former public
monopoly) service by 11 percent per hour (inflation adjusted).
From 1988 to 1995, bus costs were than $120 million less than if costs had continued to
rise at the previous rate. (Figure #12: Competitive Contracting in Denver).(24)
Indianapolis: Indianapolis competitively contracts 70 percent of its bus system. This was made
possible through state legislation that placed state public transit subsidies under the control of the
city of Indianapolis, rather than the public transit agency. Using its funding leverage, the city has
placed the entire system under a "mobility manager," by which separation of policy from
operations has been established. (The mobility manager is a consulting firm that oversees public
transit service contracts for the city of Indianapolis.) The public operator won a major contract by
an immediate cost per hour reduction of 22 percent. Since beginning competitive contracting,
Indianapolis has increased bus service levels by 38.4 percent, while total operating costs have
increased only 8.5 percent (1994 to 1996, inflation adjusted).
London (1.1 billion annual linked trips [transfers not counted] and 6,000 buses) is converting its
entire bus system to competitive contracting. London Transport (LT)(25) has the developed world's
largest public transit bus system with more than 5.000 buses and carrying 1.1 billion annual
linked trips. Under a parliamentary mandate, LT has competitively contracted 57 percent of its
bus services. During 1997, competitive contracting will be expanded to approximately 80
percent; conversion to 100 percent will be completed in 1999. Nearly 40 companies provide
service under more than 150 competitive contracts. Policy is separated from operations. LT
usually competitively contracts by public transit route but has competitively contracted areas as
well. Companies may receive a single contract extension if their services have met quality
standards and if they are willing reduce their cost per mile by at least 2.5 percent during the
extension period. The quality of bus service has improved substantially. Policy is separated from
operations.
Services have been expanded 28.7 percent over 11 years (1985-1996), while operating
expenses have been reduced 30.0 percent (inflation adjusted).
Costs per vehicle mile have dropped 45.7 percent, an annual cost per mile reduction of
5.4 percent.
Ridership is up three percent compared to a nearly 30 percent decline outside London,
where public transit has been deregulated rather than competitively contracted.
The public operator won more than half of the competitive contracts until it was divided
into eleven firms and sold to private investors (including management and employee
buyouts). These companies continue to operate most of the service, but at market rates.
Before competitive contracting, passenger fares covered 60 percent of operating and
capital costs. In 1996, passenger fares covered 94 percent of costs. In contrast, passenger
fares cover barely 50 percent of operating costs in the largest US public transit systems.
In this competitive environment, London Transport has been able to improve
Underground (subway or heavy rail) cost effectiveness to the point that fares now exceed
operating costs (not including capital costs).(26)
Stockholm is converting all of its bus and rail services to competitive contracting. Stockholm's
public transit system consists of 2,000 buses and 900 rail cars. Annual ridership is 570 million
linked trips. The Swedish parliament enacted public transit reforms that led to a national
conversion to competitive contracting. As of 1995, Stockholm competitively contracts
approximately 60 percent of both its bus services and its rail services (metro, light rail, and
commuter rail). Remaining non-competitive services will be competitively contracted in the near
future. According to the public transit agency, "Quality has, at a minimum, been retained
unchanged." Policy is separated from operations.
Competitively contracted bus services are 32 percent less costly than non-competitive
services.
Since beginning the conversion, total bus operating costs have declined 18.5 percent
(inflation adjusted), while bus services have been expanded by 2.8 percent (1992-1995).
Bus costs per mile have declined 20.3 percent in three years.(27)
Copenhagen is converting all of its bus service to competitive contracting. Copenhagen
Transport administers a public transit system of 1,100 buses, carrying 190 million annual linked
trips. The Danish parliament has mandated that the Copenhagen public transit bus system be
converted to competitive contracting. Copenhagen now competitively contracts 56 percent of its
system and will convert the balance by 2002. More than 20 operators provide service under
competitive contracts. The rate paid for non-competitive services (provided until conversion by
the former public monopoly) is limited to the average rate paid to contractors. Copenhagen
Transport credits competitive contracting with reversing its falling ridership trend. Policy is
separated from operations.
From 1989 to 1996, total operating costs declined by 18.5 percent (inflation adjusted),
while bus services were expanded by five percent.
Bus costs per mile have declined by 22.3 percent (inflation adjusted).(28)
Houston: Houston's Metropolitan Public transit Authority (MTA) recently competitively
contracted an entire operating division of approximately 140 buses. MTA expects to save 39
percent compared to non-competitive operating with gross savings over five years of more than
$45 million.
Los Angeles: Public transit operators in the Los Angeles have recently reached the 20 percent
competitive contracting level, consisting of approximately 550 buses (the largest number of
competitively contracted buses of any US urban area). In the late 1980s, Los Angeles
competitively contracted public transit routes that were threatened with cancellation as a result of
financial constraints. Ridership on the competitively contracted routes increased 150 percent in
contrast with the overall downward tend in Los Angeles. In an independent audit, Price
Waterhouse reported:
Cost savings of 60 percent savings per mile.
Better service quality: An improvement in service reliability of over 300 percent, a 75
percent reduction in passenger complaints, and virtually the same safety performance
relative to the public operator.
In addition, fares on the competitively contracted services have been kept lower than on the
regional system because of the lower costs.
Implementation
There have been three general patterns of implementation:
1. Immediate conversion: Transit systems have been converted to competitive contracting
(New Zealand and Melbourne) with immediate system-wide savings.
2. Gradual conversion: Transit systems are being converted to competitive contracting over
periods of three to 15 years or longer. Where the conversion is announced as five years or
less, public agencies have routinely reduced costs per mile by 15 percent or more in
response to the threat of competition (Perth, Adelaide, Brisbane, Copenhagen). Ripple
effect savings have been associated with longer term transitions (San Diego and London)
3. Ad-hoc: Transit systems have converted portions of their services with no long term
conversion intention (most U.S. cases). While direct savings occur, ripple effect savings
are less frequent because there is no routine threat of competition.(29)
Separation of Policy from Operations
Virtually all transit system conversions to competitive contracting have been associated with administrative reform through "separation of policy from operations." The public transit agency's role is focused on the mission of maximizing service and ridership within public resource constraints. It is limited to establishing and administering the transit system and forbidden from directly operating service. The transit agency purchases all of its services competitively from public and private operators. Separation of policy from operations removes the potential conflict of interest that occurs when an agency evaluates its own proposals and proposals from external organizations.
3. IMPROVING CTA THROUGH COMPETITIVE CONTRACTING
Competitive contracting can achieve similarly successful results at CTA. If CTA bus operating
costs had declined at the same rate as in San Diego, fares could have been maintained at 1985
levels on both bus and rail services. Moreover, CTA bus costs per mile are significantly higher
than that of San Diego --- far higher than could be justified by any difference in price levels or
labor markets between the two cities. This suggests a potential for CTA productivity
improvements even greater than of San Diego.
An approach to competitive contracting of CTA bus service is considered --- the "Job Guarantee
Alternative. It is analyzed relative to the present trend outlined above (the "Status Quo
Alternative).(30) Further, the Job Guarantee Alternative assumes no administrative savings --- all
of the savings are assumed to result from improved productivity in operations and vehicle
maintenance.(31) It is likely that additional savings could be achieved from competitively
contracting administrative functions as well. The savings from competitive contracting are
assumed to be applied to fare reductions on bus services, which provide the basis for bus
ridership projections.(32)
CTA and The Market Rate
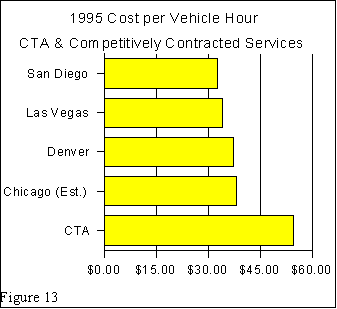 CTA bus operating and maintenance costs were $54.50 per vehicle hour in 1995, exclusive of administration and non-vehicle maintenance(35) --- 43 percent higher than the estimated market rate (Appendix: Model Assumptions) (Figure #13: "Capital Cost per Vehicle Hours: CTA &
Competitively Contracted Services").
If CTA bus costs had declined to the market rate, most of the fare increases (bus and rail) since
1979 would not have been necessary,(36) and it is likely that much less (or even none) of the
ridership loss would have occurred. It is estimated that over the next 10 years, CTA bus costs
above the market rate will be more than $1.6 billion. Over the next thirty years (1998-2027),
above market costs are projected at from $2.9 billion to $6.6 billion.(37)
If CTA bus services were provided at market rates, with the savings used to reduce fares, a
ridership increase of 17 percent would be likely (compared to 1997). This ridership would still be
well below the 1979 peak (Regrettably, it is easier to lose transit ridership than to regain it.) Still,
such an increase in ridership would be very beneficial to customers and the community. Savings
might also be used to expand services --- increasing service frequencies, or expanding the route
system, especially community circulators.
4. IMPLEMENTATION STRATEGIES AND IMPLICATIONS
To best serve its customers and the community, CTA should seek to maximize its productivity as
quickly as possible --- CTA should reduce its costs to market rates (while maintaining or
improving service quality), so that fares can be reduced and higher levels of mobility provided
for bus riders.
There is only one reliable way to produce transit services at the market rate, and that is to use the
market. The CTA bus system should be converted to competitive contracting as quickly as
possible.
The "Job Guarantee" Competitive Contracting Program
CTA bus services could be converted to competitive contracting at a rate that would guarantee all
present operating employees their jobs, while requiring no reduction in the compensation of
existing employees. Competitive contracting would be phased in at the rate allowed by the
natural attrition rate of employees --- the rate at which CTA employees voluntarily leave their
jobs through retirements and resignations.
By 2007, approximately 45 percent of bus services would be competitively contracted under the
Job Guarantee Alternative. The "ripple" effect would have reduced the costs of the 55 percent of
services still provided non-competitively by CTA, but not yet to market levels. This "Job
Guarantee Alternative" would incur excess costs (above market costs) of $794 million over the
next 10 years, compared to the more than $1.6 billion under the Status Quo Alternative,(38) a
payback of 2.0 to one.
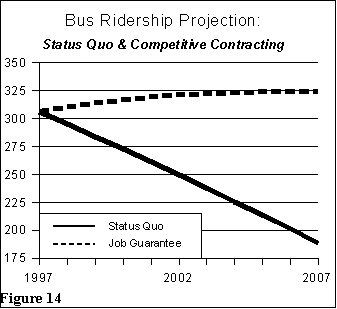 If savings were used to reduce fares, ridership is projected to rise by eight percent over 10 years,
to 323 million annually --- 72 percent higher than the status quo alternative (Appendix: Model
Assumptions). Weekday persons served would increase from 497,000 to 525,000 (Figure #14:
Bus Ridership Projection).(39)
Nonetheless, CTA's cost crisis is so severe that even more immediate and significant financial
relief should be sought. The job guarantee alternative could be more effective if combined with a
voluntary separation and early retirement incentive program. It is estimated that such a program
could increase overall ridership over 10 years by an additional two percent. This, and other
strategies should be reviewed to advance the pace of conversion to competitive contracting,
while observing the interests of existing employees. A recent report indicated that CTA bus
services planned for cancellation could be retained, with cost savings of $38.7 million, through
competitive contracting.(40)
Competitive Contracting Packages for Year 1
Under the Job Guarantee Alternative, approximately six percent of CTA's bus service would be
converted to competitive contracting each year. The performance of CTA's least productive bus
routes could be improved by inclusion in competitive contacting packages. As an example, two
packages of lower performing routes were developed --- one on the north side and the other on
the south side (Table #1).(41) Each of the packages represent approximately three percent of CTA
bus vehicle hours. It is estimated that the first year direct savings (not including "ripple effect"
savings) would be $8.5 million.
Competitive Impact on CTA Rail Services
It is likely that the "ripple" effect of market rate bus costs would positively impact unit costs in
CTA rail operations, improving results even more. This analysis does not assume a ripple effect
with respect to CTA rail services.
5. IMPLEMENTATION ISSUES
Customers
 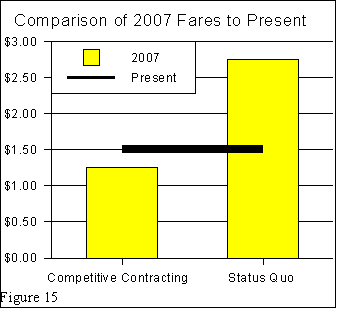 If the savings were used primarily to reduce fares, CTA services would become more affordable, serving from 219,000 additional people daily (weekday round trip riders). The base could be reduced from the 1995 level of $1.50 to approximately $1.25. Under the Status Quo Alternative, fares would rise to $2.75 (Figure 15: "Comparison of 2007 Fares to Present").(42)
If the savings were used to increase service levels, while maintaining fare increases
within inflation, similar ridership increases would be likely to occur. Services could be
expanded by approximately 10 percent by 2007. Alternatively, under the Status Quo
Alternative, a 25 percent service reduction would be required by 2007 to balance the
budget by adjusting service levels. (Figure 16: Comparison of 2007 Service Levels to
Present).
The human dimension of this improvement is substantial. The savings from competitive
contracting can make it easier for the economically disadvantaged to obtain and hold
employment, and facilitate more rewarding living standards that are associated with improved
mobility. Bus service that is more attractive to the economically disadvantaged will also facilitate
employment mobility under the new welfare reform bill. At the same time, savings from
competitive contracting will make CTA service more attractive to discretionary riders, thereby
reducing the increase in traffic congestion.
Service Quality
One of the most frequently recurring concerns about competitive contracting regards service
quality. Sometimes this concern arises from an assumption that private service must necessarily
be of lower quality than public service, since private operators are driven by the profit motive.
Indeed, it is this very profit motive that is the best guarantor of quality service, because failure to
provide quality service is likely to, and should, result in sanctions including contract termination.
The private sector provides many of the most important goods and services in society. Grocery
stores are operated by the private sector; baby formula is produced by the private sector;
telephone service is provided by the private sector, etc. Generally, government is not perceived
by people as a high quality service provider --- Federal Express and United Parcel Service are
perceived as better service providers than the United States Postal Service.
Private transportation providers produce one-third of the nation's school bus service, two-thirds
of the nation's paratransit service for the elderly and disabled, and more than 10 percent of
conventional bus transit services. They would not be providing these services if their quality
were substandard.
The overwhelming evidence is that private operators produce quality bus service in competitive
contracting applications. Audits by "big six" accounting firms in Los Angeles and Denver found
privately operated service to be equal to, or better than publicly operated service. London
Transport found that privately operated service was generally of higher quality, and that when the
public operator provided service in a competitive environment (faced with the threat of contract
cancellation, like private carriers), service quality improved on the same services. Very little
service converted to competitive contracting has reverted to non-competitive operation, and
where it has, political pressures from transit unions, rather than service quality, has been the
driving force.
Job Creation 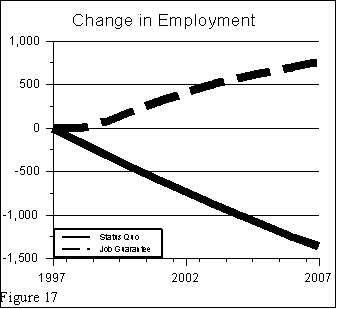 Conversion of CTA services to competitive contracting would increase the number of transit
operating jobs available if the savings from competitive contracting were used to expand services
(while keeping fare increases at or below the inflation rate) Under the Job Guarantee Alternative
more than 700 bus driver and mechanic jobs could be created.(43) On the other hand, up to 1,350
jobs could be lost under the Status Quo Alternative (Figure #17: Change in Employment).
CTA Employees
Competitive contracting would be more than equitable to CTA employees. Under the Job
Guarantee Alternative, all CTA employees would continue to be employed by CTA. In an
economy characterized by "downsizing," and an increasing perception of employment insecurity,
either of these alternatives is very generous to CTA employees.
Further, contractor employees, like all other employees, would decide whether or not their
employers operate under union contracts.
Minority and Disadvantaged Business Enterprises
Competitive contracting would also provide entrepreneurial opportunities. By using a variety of
contract sizes from small to large (in terms of buses required), new businesses, minority business
enterprises and other disadvantaged business enterprises could be successful competitors. CTA
could also undertake programs to encourage and orient disadvantaged business enterprises with
respect to competing for service contracts.
CTA Capital Assets
CTA assets, such as operating garages and buses, should be leased to contractors, so long as this
results in lower costs. Excess capital assets can be sold with proceeds contributed to other capital
improvements (especially rail system improvements).(44)
Separation of Policy from Operations
Competitive contracting will be more successful if policy is separated from operations (Section
2: Competitive Contracting, above).
Policy would be separated from operations under the Employee Buy-Out Alternative and
CTA would no longer employ operating personnel.
CTA could establish an internal separation of policy from operations for the purpose of
competitive contracting administration under the Job Guarantee Alternative. This would
require measures to ensure that the proposal evaluation process is objective and that
internal CTA competitive proposals are subject to the same terms and conditions as
private proposals. Such processes have been established in London, Detroit, St. Louis,
Cincinnati and elsewhere.
6. SECURING A BETTER TRANSIT FUTURE FOR CHICAGO
The Chicago Transit Authority has sustained unprecedented ridership losses, which are primarily
attributable to substantial fare increases. If present trends and operating methods are allowed to
continue (the Status Quo Alternative) weekday ridership can be expected to drop by 38 percent,
from 497,000 daily in 1995 to 306,000 by 2007. Over the next decade, CTA above market bus
costs are projected at $1.6 billion, then escalating from $2.9 billion to $6.6 billion over 30 years.
However, CTA can reverse its decline by implementing a fully achievable program to improve
cost efficiency through competitive contracting.
If savings are committed to reducing fares, it is expected that CTA's bus ridership decline would be reversed, with an eight percent increase over 10 years. Under the Job Guarantee Alternative, daily persons served is projected to increase to 525,000 in 2007 --- 72 percent above the ridership under the Status Quo Alternative. 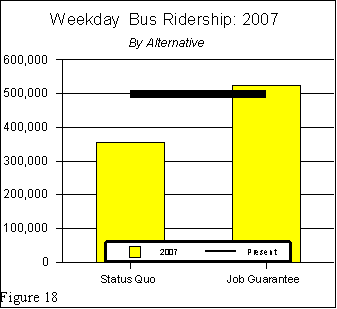 Above market costs would be $794 million over ten years --- 51 percent less than the
Status Quo Alternative.
Above market costs would drop to near zero over 30 years. Over that period, above
market costs would total $1.1 billion --- 62 percent to 83 percent less than under the
Status Quo Alternative.
Under the Job Guarantee Alterative, no CTA employees would be laid off.
CTA cannot achieve its public purpose unless it commits its resources, without reservation, to
serving its customers. Under the Status Quo Alternative, CTA is projected to spend $1.7 billion
more than necessary over the next 10 years, while serving 191,000 fewer people daily (round
trips). The competitive contracting alternative is less costly and would increase ridership, while
treating CTA employees very generously (Table #2). Competitive contracting would increase the
number of people served by 219,000 daily compared to the present trend (Status Quo
Alternative).
Competitive contracting offers CTA the opportunity to provide greater mobility to its customers
(Figure #18: Weekday Bus Ridership: 2007). CTA should begin the process of recovery by
competitively contracting as much service immediately as can be accommodated without laying
off employees (approximately six percent annually). The stakes are very high. To remain viable
in the longer term, Chicago will require an intensively used, quality public transit system. CTA's
decline must be reversed. Both CTA's riders and the city deserve no less than the improved
transit that competitive contracting would bring.
APPENDIX: MODEL ASSUMPTIONS
A model was developed to project competitive contracting results over the period of 1997 to 2007. It is
assumed that non-competitive operations would continue in 1997 (the base year), and that conversion to
competitive contracting would begin or occur in 1998.
Assumptions: All Alternatives:
All data is in 1997 dollars (inflation adjusted) unless otherwise noted.
1996 bus ridership
Fares at 1995 levels.
1997 service level estimated based upon CTA 1996 projections (1996 Annual Budget Summary;
1997-1998 Financial Plan, January 1996).
Analysis is limited to operating costs (capital costs are excluded unless otherwise noted).
Total operating revenues (fares and subsidies) will decline 1.7 percent annually (CTA projected
1994-1999 rate used).
CTA bus costs per vehicle hour will increase 1.2 percent annually, inflation adjusted (actual
1990-1995 rate used).
Ridership losses assumed at 0.36 percent for each 1.0 percent increase in fares, not inflation
adjusted. Ridership increases assumed to be 0.36 percent for each 1.0 percent reduction in fares
(based upon American Public Transit Association).
Ridership losses assumed at 0.78 percent for each 1.0 reduction in services. Ridership increases
assumed to be 0.78 percent for each 1.0 increase in service (based upon analysis of 1985-1994
National Transit Database).
CTA bus operating costs from National Transit Database (vehicle operations and vehicle
maintenance only; non-vehicle maintenance and administration excluded).
Competitive operating costs based upon 1992 $35.00 per vehicle hour estimate, inflated to 1997
(FTA Triennial Review Private Enterprise Participation --- Compliance Corrective Action,
Chicago Transit Authority, December 21, 1992).
Competitive contracting costs per hour would increase at the inflation rate.
Assumptions: Status Quo Alternative
Fare increase by 2007 to $2.75. This fare increase would maximize the reasonably expected
potential fare revenues -- a larger fare increase would be likely to result in reduced fare
revenues.
The balance of the deficit between total operating revenues and operating costs would be closed
by reducing service levels by 15 percent.
Service Reduction: Additional projection assumes that the deficit will be financed by service
reductions, with fares remaining at 1997 levels (not inflation adjusted)
Jobs lost based upon CTA ratio of operating employees to vehicle hours.
Job Guarantee Alternative
Savings would be used to reduce fares.
CTA operating employee attrition rate assumed at six percent annually.
Services would be converted to competitive contracting at the operating employee attrition rate.
CTA non-competitive costs would decline 1.2 percent annually (inflation adjusted) --- a "ripple
effect" reaction to competitive contracting (based upon the experience in San Diego).
END NOTES
1. Calculated from National Transit Database: 1994. 2. Calculated from National Transit Database: 1994. 3. Calculated from National Transit Database: 1979 and 1995. 4. Weekday ridership estimated based upon analysis of CTA National Database Report. 5. Calculated from National Database and American Public Transit Association data. 6. Estimated using U.S. Census Bureau data. 7. 1979 was the recent peak in CTA bus and rail ridership. 8. Census Bureau data for jobs in 1979 and 1995 is unavailable, which is why the 1980 to 1990 comparison is used. 9. Calculated from United States Census Bureau data. 10. Calculated from National Transit Database. 11. From Fare Elasticity and Its Application to Forecasting Transit Demand (American Public Transit Association). 12. The American Public Transit Association formula would predict a ridership loss of 31.2 percent based upon CTA fare increases from 1985 to 1995 --- the ridership loss was 31.3 percent. 13. CTA Five Year Forecast (September 13, 1996). 14. John McCarron, "Running on Empty?: In Need of A Serious Overhaul, CTA Should not be Allowed to Collapse," Chicago Tribune (August 12, 1996). 15. Analysis of data in Texas Transportation Institute, Urban Roadway Congestion - 1982 to 1992 (September 1995). 16. CTA Five Year Forecast (September 13, 1996). 17. A base fare increase to $2.75 over 10 years. A fare increase of this percentage achieves approximately the greatest amount of new revenue. A much higher fare increase would pas the point of diminishing returns --- a reduction in overall fare revenues. The balance of the deficit is assumed to be made up by service reductions of approximately 15 percent. 18. 18. Proposers should be required to specify all unit costs for the entire contract length (except where the terms of the request for proposals specify periodic rate adjustments based upon the inflation rate).. 19. Based upon analysis of the National Transit Database. 20. The Citizen's Network (The European Commission), 1996. 21. Wendell Cox, Competitive Contracting: The International Revolution and Implications for America, Presentation to the Eastern Regional Conference of the Council of State Governments (July 1996). 22. Calculated from historical data in Metropolitan San Diego Short Range Transit Plan (Metropolitan Transit Development Commission). 23. Calculated from National Transit Database 1992-1994, and ATC-Vancom 1995 National Transit Database report (operations and maintenance costs). 24. Management/Administration Study for the Regional Transit District (Denver), (Mundle & Associates and Wendell Cox Consultancy), 1996. 25. London bus ridership is at least four times CTA's bus ridership. 26. Calculated from data in London Transport Annual Reports. 27. Calculated from data in Annual Report 1995 (AB Storstockholms Lokaltrafic). 28. Information provided by Copenhagen Transport (HT). 29. For example, ad hoc service contracting has occurred in Los Angeles, Seattle, Washington, DC and elsewhere. Non-competitive costs have continued to rise without the threat of competition. 30. If more or less optimistic assumptions are applied to the Status Quo Alternative, comparative results of the same magnitude would result under each of the alternatives considered. 31. No savings are assumed in non-vehicle maintenance (such as capital facility maintenance). 32. CTA has an integrated bus-rail fare system. For simplicity, this analysis confines the impact of competitive contracting to bus services, with all savings used to lower bus fares. If savings were used to reduce bus and rail fares, virtually the same ridership increase would be projected. 33. In 1992, CTA estimated competitive costs at $35.00 per vehicle hour, which is $38.03 in 1995$. Bus Route Operating "Cost Comparison with the Private Sector (Chicago Transit Authority, December 18, 1992). 34. Calculated from National Transit Database 1995 and Mundle & Associates. 35. Calculated from National Transit Database. 36. It is estimated that CTA bus operating costs are $135 million higher than market. Total fare revenues increased $157 million from 1979 to 1995. 37. The higher projection relies upon the assumptions used for 1998 to 2007. The lower projection assumes that the national conversion to competitive contracting will be well underway by 2008, creating competitive pressures that keep the gap between CTA costs and market costs from expanding. 38. Difference between competitive costs and non-competitive costs using assumptions above. 39. Status Quo Alternative assumptions used, with savings applied to fare reductions. 40. Anthony M. Pagano, "An Analysis of Proposed CTA Service Cuts: New public Sector Management Alternatives," (Metropolitan Transportation Association, May 1997). 41. Routes selected from CTA Bus and Rail Route Performance: March 1996. 42. Even a fare increase to $2.75 would be insufficient to balance CTA's budget in 2007. There would be no point in raising fares higher, because the point of diminishing returns would soon be met (the point at which higher fares result in lower fare incomes, because of ridership losses). 43. Assumes that savings would be used to expand services. 44. Disposition of sales proceeds from assets financed with federal funding would require consultation with and approval by the federal government.
 
| P. O. Box 841 - Belleville, IL 62269 USA Telephone: +1.618.632.8507 - Facsimile: +1.618.632.8538 Contact Us by E-Mail The Public Purpose | Demographic Briefs | Government Cost Review | Government Employment Fact Book Highway & Motorway Fact Book | Intercity Transport Fact Book Labor Market Reporter | Realities | School Transport Fact Book Transport Fact Book | Urban Policy | Urban Transport Fact Book | Competitive Tendering Website International Competition & Ownership Conference New Items | Book Store | Subscribe (Free)

DEMOGRAPHIA | ||||||||||||||||||||||||||||||||||||||||||||||||||||||||||||||||||||||||||||||||